BOFIT Weekly Review 23/2021
Developments in industry, trade and fixed investment vary across Russia
The magnitude of the economic contractions experienced in spring 2020 varied considerably across Russia’s federal districts, with some regions even experiencing growth. In any case, the duration of the contraction was fairly brief for most of Russia. This is reflected in the figures for the full year 2020. Manufacturing output barely contracted in those five federal districts (out of the total of eight) that together account for over 90 % of all of Russia’s manufacturing activity. In the Central and Ural federal districts, 2020 manufacturing output even rose by 5–6 % from 2019, while it declined by only a half percent to two percent in the three other federal districts (Northwestern, Volga and Siberian). The volume of retail sales in the Northwestern Federal District was the same as in 2019. It decreased by 2 % in the Central Federal District and by about 3–4 % in five other federal districts. Fixed investment at its deepest contracted by 3−4 %, which concerns two important federal districts, including the Central Federal District, and remained largely unchanged in three other significant federal districts, including Northwestern.
Differences are apparent also when comparing current levels to levels before last year’s Covid recession. The change in manufacturing output from January-April 2019 to January-April 2021 varied quite widely in the five federal districts where most manufacturing occurs. In the Central Federal District, growth from two years previous was 18 %. Half of the increase came from a nearly 20 % jump in output from the City of Moscow, which is an extension of the growth in Moscow’s manufacturing that began in 2018. Moscow accounts for 15 % of the entire country’s manufacturing output. The City of Moscow is further surrounded by the Moscow region (Moscow oblast), which accounts for 6 % of the country’s manufacturing. The region’s manufacturing continued to rise for the sixth consecutive year and was up by 25 % in January-April from the same period in 2019. In the Northwestern Federal District, manufacturing output in January-April was up by less than 3 % from two years previous. This includes the Leningrad region (Leningrad oblast), where production rose by 7 % (over 2 % of national manufacturing output). After a couple of years of high growth, there was no growth in manufacturing output in the City of St. Petersburg, which accounts for over 5 % of manufacturing. In the three other federal districts with substantial manufacturing activity there were also large differences (up 7 % in Volga, up 14 % in Ural and down 3 % in Siberian).
Changes in the volume of retail sales in the first four months from two years ago show less variation. The rise in retail sales in Russia has come more or less fully from sales growth in the Central, Northwestern and Southern federal districts, which together account for 55 % of retail sales nationally. Retail sales in these three federal districts have increased by 7−9 % from two years previous, while the change in nearly all other federal districts has been only between -1 % and +2 %. In the Central and Northwestern federal districts, 85 % of retail sales growth has come came from large urban areas. In Moscow, which accounts for 15 % of the nation’s retail sales, retail sales were up by over 6 % after increasing reasonably well in the two previous years as well. St. Petersburg, which accounts for nearly 5 % of retail sales, saw growth of nearly 11 % after growing quite briskly in the two previous years. The Moscow region, with a nearly 8 % share, and the Leningrad region surrounding St. Petersburg, saw growth of 12−13 %, continuing their latest growth surge that began in 2017 to become concentrations of commercial activity which includes serving e.g. Moscow and St. Petersburg.
Movements in fixed investment are uneven for different parts of Russia, while it is also worth having caution in mind when comparing short periods especially in investment activity which varies seasonally as well as due to large projects. Much of the rise in fixed investment between the first quarter of 2019 and the first quarter of 2021 came from Moscow, where fixed investment rose by over 20 %, continuing a rapid rise that began in 2017−2018. Moscow accounts for 17−18 % of the country’s total fixed investment. Moscow also drove the investment growth figure in the Central Federal District to over 12 % and a 30 % national share. In the Northwestern Federal District (over 10 % share), much of the nearly 10 % drop in fixed investment was due to a 30 % fall in the Leningrad region from the first quarter of 2019, ending a multi-year investment boom, as well as a nearly 8 % drop in the City of St. Petersburg after a strong rise in 2018. With respect to fixed investment in the Ural and Volga federal districts, which each account for 14−15 % of investment nationally, growth was in the range of 1−3 % from two years previous.
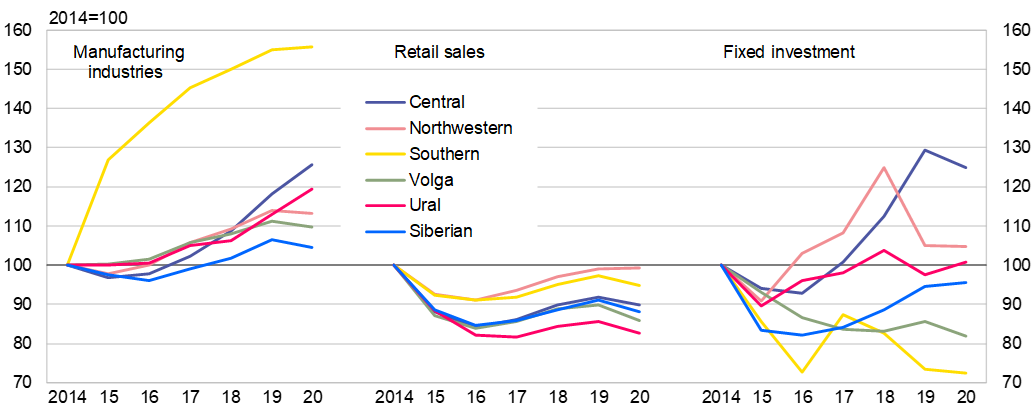
Since the mid-2010s, manufacturing output and fixed investment in particular have followed divergent trends in various parts of Russia. Differences in retail sales are also apparent, but even last year retail sales in Russia’s six most important federal districts were still below their 2014 levels that preceded the downslides. In the Northwest Federal District, retail sales last year nearly matched their 2014 levels.
While trends in retail sales have generally been weak in Russia’s federal districts, manufacturing has grown and fixed investment trends have ranged widely

Sources: Rosstat and BOFIT.