BOFIT Weekly Review 12/2025
Chinese economy off to a relatively good start this year; capital outflows surged last year
A robust trend in industrial output growth continued in the first two months of this year (5.9 % y-o-y). Growth was only slightly lower than in December and roughly matched the average pace of growth for all of 2024. Manufacturing output growth, which has been climbing since the final months of last year, reached 6.9 % y-o-y in January-February. Categories with the highest growth included electronics (up 12 %), automobiles (12 %) and vehicles other than automobiles (21 %).
Although retail sales, a rough proxy for domestic consumption demand, perked up a bit in the first two months of this year, it remained sluggish. The value of retail sales grew by 4 % in January-February. Sales of household appliances (value of sales up 11 % y-o-y) and electronics (up 26 %) have gotten a boost this year from the government’s expanded rebate programme for durable goods, which grants subsidies to certain products. During this year’s Chinese Lunar New Year holiday (Jan. 28 – Feb. 4), the number of domestic travellers was up by 6 % from 2024, and about 20 % greater than in 2019.
Strong international demand boosted demand last year, and the value of China’s goods exports in January-February was up another 2 %. The data on export volumes this year are not yet available. The value of China’s goods imports fell by 8 % in January-February. The outlook for exports has been clouded by the Trump administration’s decisions in February and March to impose additional 20 % tariffs on China (BOFIT Weekly 10/2025).
China’s real estate sector collapse continues. The volume of apartment sales in January-February measured in terms of floorspace fell by 5 % y-o-y. The value of real estate investment declined by 9 % y-o-y. At the national level, the average apartment price continued to slump, but official figures released by the National Bureau of Statistics (NBS) show prices in China’s biggest cities (Beijing, Shanghai and Shenzhen) have been on the rise since October. For all of China NBS figures show that the average price for new apartments in February was down by 5 % y-o-y (down 10 % from the 2021 peak), while prices in the secondary markets were down by 8 % (down by 17 % from 2021). According to some reports, price drops in some areas have been much larger than stated by official figures.
Inflation remained quite modest in the first two months of this year, even if prices in January-February were subject to the usual swings of the New Year holidays. Consumer price inflation in January rose by 0.5 %, and fell by 0.7 % in February. The 12-month change in producer prices has been declining for over two years now (down by 2.2 % in February). Growth of the credit stock has also been slowing for several years. The stock of domestic bank loans grew by 6.8 % y-o-y in February.
Industrial output growth remained strong in the first two months of this year, while apartment construction & sales declined
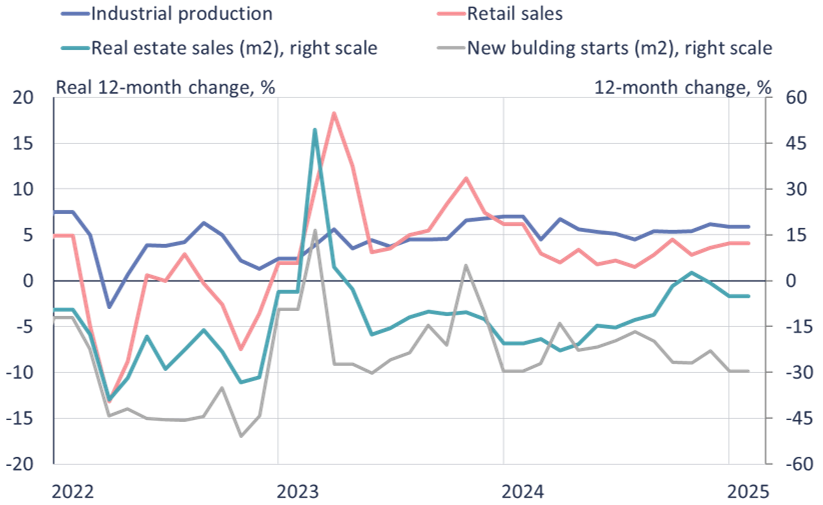
Note: Estimate of real growth in retail sales based on consumer price inflation figures.
Sources: NBS, CEIC and BOFIT.
China posted large Current account surplus last year, but financial account figures also reveal increased capital outflows
China’s latest balance-of-payments (BoP) data show the country’s goods trade surplus last year amounted to $768 billion and the services trade deficit $229 billion. The value of China’s services exports was $384 billion and services imports $613 billion. Tourism services accounted for a significant share of services imports ($250 billion), indicating that Chinese tourists spent more abroad than in 2023. In contrast, tourism in services exports was a mere $40 billion. Transport services accounted for nearly a third of all services exports and imports. Other services trade categories were fairly small. China last year paid out international intellectual property royalties (e.g. licencing fees) totalling $46 billion, while IP fees paid to China amounted to $10 billion. When other current account items are included, China’s current account surplus last year amounted to $421 billion (2.2 % of GDP).
China’s financial account showed a record deficit of $450 billion (including the change in reserves). The capital outflows from China indicated in the financial account exceeded inflows into the country in the current account. More than a third of the financial account shortfall ($167 billion) came from the deficit in foreign direct investment (FDI). Specification of other items is not yet available. China’s BoP statement shows outward FDI amounted to $172 billion last year. Inbound flows of FDI to China were very modest, just $5 billion. The inbound FDI flows were negative in the second and third quarters of last year, likely reflecting divestment of assets or negative reinvested earnings by foreign firms operating in China. The BoP accounting also shows a $62 billion drop in China’s foreign currency reserves last year. The value of China’s foreign currency reserves based on People’s Bank of China reporting, which takes into account valuation shifts, declined by $36 billion last year to $3.202 trillion (17 % of GDP).
The financial account in China’s balance-of-payment statement shows that the amount of capital flowing out of the country last year exceeded the inflows in the current account
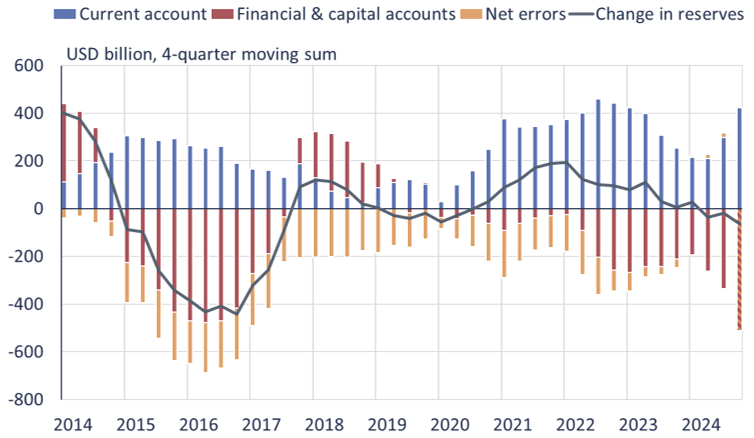
Note: Capital account figures or the “net errors and omissions” term not yet available for 2024Q4.
Sources: SAFE, Macrobond and BOFIT.