BOFIT Weekly Review 06/2025
China’s inflation remained subdued last year; obtaining a picture of overall price trends is not straightforward
Unlike most countries, China has avoided a spike in prices in the post-pandemic period. Consumer price inflation was just 0.2 % p.a. in both 2023 and 2024. Regional differences in consumer price inflation are also surprisingly small. Last year the range of changes in consumer prices for China’s 31 regions varied between -0.3 % and +0.5 %.
Price changes in consumer price inflation sub-categories have also been modest. For example, prices of services last year rose by 0.7 %, while prices of consumer goods fell by 0.1 %. The fastest rises in prices were in the category for entertainment and tourism services (+3.5 % in 2024). In addition, prices were up slightly for education services (+1.6 %), healthcare (+1.3 %) and clothing (+1.4 %). Food prices were generally down (-0.6 %), due to such factors as lower prices for meats other than pork, fruit, cooking oil and eggs. Pork prices again rose last year (+8 %). Prices fell in the categories of transportation (down 5.1 %), fuels (-0.7 %) and rents (-0.2 %).
Manufacturing, export and apartment prices all declined last year
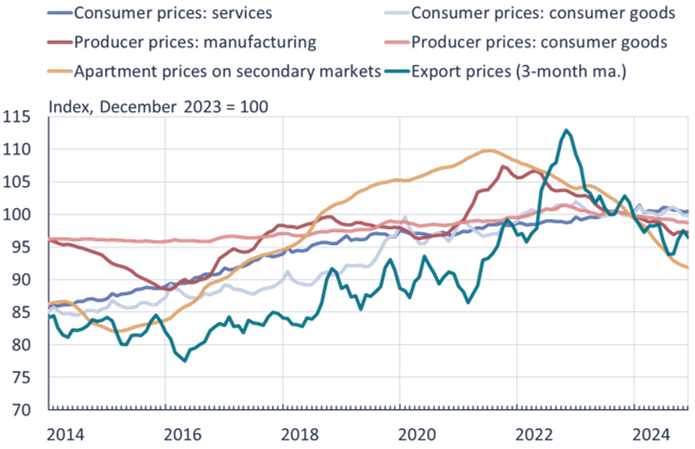
Sources: China National Bureau of Statistics, China Customs, CEIC and BOFIT.
It has become more difficult to monitor prices in China as the National Bureau of Statistics (NBS) has ceased to publish major data series, including retail sales prices and fixed asset investment prices. The IMF, for example, notes that following consumer and producer price changes is complicated because China do not publish the weights used in the subcategories, making the factors that drive price changes difficult to monitor. The NBS updates its weightings at five-year intervals. Food prices are known to have a heavier weighting in China’s price indexes than the weightings used in more advanced economies. Several estimates evaluate that the share of food in CPI basket has fallen to around 20 %, down from about a third around a decade ago. The NBS also collects on a weekly basis data on prices of specific food items sold in marketplaces and supermarkets, as well as monitors prices of industrial production factors at ten-day intervals. It is difficult, however, to extrapolate general price trends from these specific items.
Changes in consumer prices are also mitigated by the fact that energy prices in China are still partly regulated. While retail prices for gasoline and diesel oil generally track global oil prices, officials impose price ceilings and may at times intervene in pricing if necessary. In December, the price of 95-octane gasoline averaged 8 yuan (1.1 euros) per litre ($4.2 per US gallon), a drop of 3 % from a year earlier. Household prices for electricity, in contrast, have remained unchanged since 2017. There were small variations in the prices industry pay for electricity, and last year the average price across the country declined slightly.
Only limited nationwide figures on housing price trends are available. While the NBS releases information on housing prices in 70 major cities, some observers claim they show more modest price trends that what seems to be actually happening in the markets. This is particularly relevant in current circumstances given the troubles of the real estate sector and the fact that the numbers of sold apartments are small in many regions. Official figures show that prices of existing apartments in 70 cities fell last year by 9 % on average (down 16 % from the 2021 price peak), and that prices of new apartments dropped by 6 % (down by 9 % from the 2021 peak). Price drops in Beijing and Shanghai have been more modest than in most of the country. Price declines have been largest in smaller cities.
Producer prices last year fell by 2.2 % and manufacturing production prices by 2.9 %. Prices fell for manufacturing of electronics and machinery, and especially in heavy industry such as coal mining, oil refining, as well as production of chemicals, minerals and some metals. The slide in producer prices has also been reflected in lower export prices. Unit prices of exports were down on average by 6 % last year.
A GDP deflator is used to measure price changes in the economy as a whole. The NBS does not release its GDP deflator, but it can be implied as the difference between reported nominal and real GDP growth. China’s GDP deflator last year was ‑0.8 %, meaning that prices of goods and services produced in the economy declined on average. Uncertainty also surrounds China’s GDP deflator as many suspect that real GDP numbers may be overstated if needed by underestimating the implied price changes. BOFIT's alternative estimate of China's GDP, for example, is based on this assumption and it re-estimates the GDP deflators using various methods.
China’s GDP deflator has been negative for almost two years
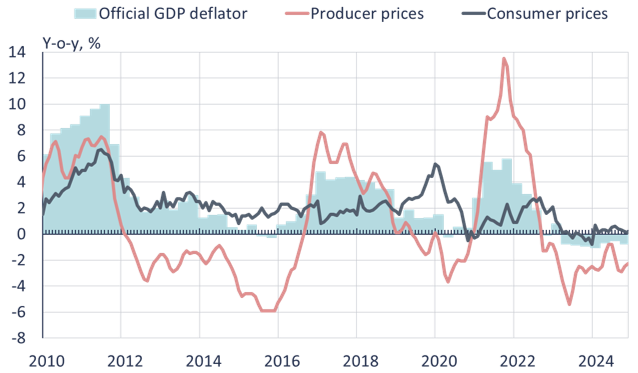
Sources: China National Bureau of Statistics, CEIC and BOFIT.