BOFIT Weekly Review 4/2025
China posted strong export performance last year; fossil fuels represent a large share of imports
China Customs reports that the dollar value of China’s goods exports grew by 6 % last year, hitting a record high of $3.58 trillion. The volume of exports grew even faster than the value, as export prices on average fell from the previous year. Prices have been depressed by heavy investment new industrial production capacity, tepid domestic demand and a weak yuan. Like goods exports, exports of services grew briskly. Figures for the first 11 months of last year show services were on track to break the previous annual record ($366 billion in 2022). Growth in imports, however, was subdued due to weak domestic demand stemming from China’s internal economic conditions. The value of good imports rose to $2.59 trillion, a 1 % increase from 2023. Services imports likely hit the $600-billion mark last year. China Customs figures show that strong exports and weak import growth raised the goods trade surplus to nearly $1 trillion. However, China’s balance-of-payments figures suggest that the surplus in goods and services trade is significantly smaller due to the large services trade deficit and measurement differences in goods trade.
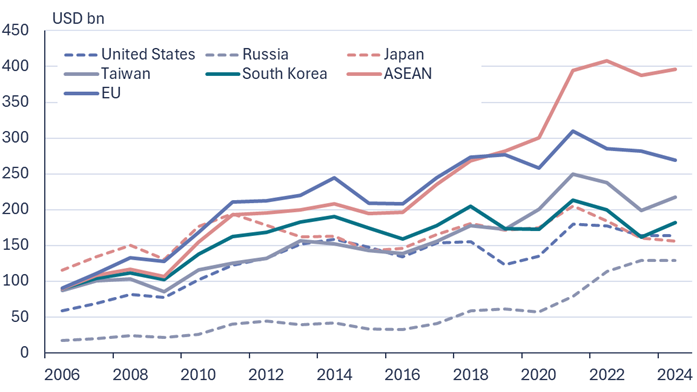
Measured in dollars, growth was led by goods exports to ASEAN countries in southeast Asia (up 12 %), making the region China’s most important export destination last year. Some of the goods exported to ASEAN countries are intended for further processing before being sent on to their final destination typically in Western markets. As a result, the US and EU remain China’s most important end markets. China’s direct exports to the US grew by 5 %, boosted by worries at the end of last year over the additional tariffs on Chinese products threatened by incoming president Donald Trump. Exports to the EU were up by 3 %, Latin America 13 %, Taiwan 10 % and Russia 4 %, while exports to Japan, South Korea and Australia contracted by a few percent. About 55 % of China’s goods exports last year were in the machinery & equipment category, including such high-growth subcategories as ship exports (57 %), microchips (17 %), vehicles (16 %) and home appliances (14 %).
Growth in goods imports was generally weak. The value of goods imported from the EU contracted by 4 % y-o-y and imports from the United States remained as the same level as in 2023. The exceptions were South Korea and Taiwan, of which China imported about 10 % more goods than in 2023 in value terms. Much of this growth reflected booming microchip demand in China.
China’s goods imports suppliers by country

Sources: China Customs and BOFIT.
Fossil fuels accounted for nearly a fifth of chinese goods imports last year
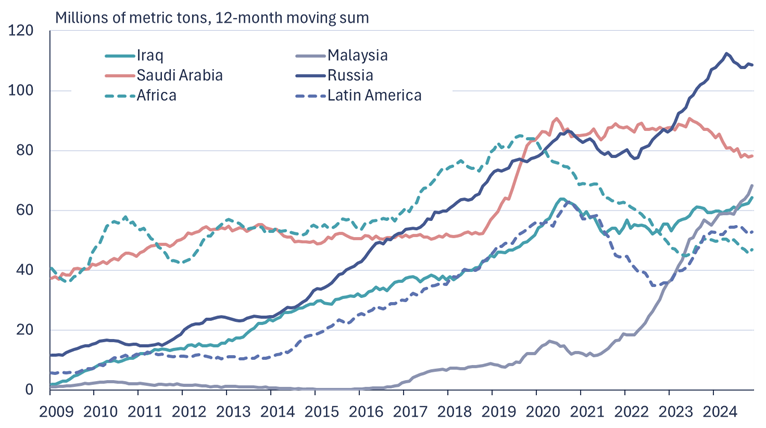
Crude oil, natural gas and coal represented about 17 % of China’s total goods imports last year. China does not need to import all of the oil it uses. The NBS reports that nearly 30 % of the crude oil consumed in China is also produced in China. Even with domestic production, however, crude oil represents a fairly substantial share of China’s total goods imports – last year just over 12 %. Crude oil imports volume contracted slightly last year. China has diversified the countries it relies on for crude oil supplies. With Russia’s invasion of Ukraine in 2022, China increased its purchases of Russian oil (which it has been buying at a discount), but it did not further increase its import volumes from Russia last year. China Customs reports that the volume of China’s crude oil imported from Russia last year represented about 20 % of its crude imports, followed by Saudi Arabia with less a than 15 % share and Iraq with just over 10 %. While Malaysia appears on paper to have accounted for over 10 % of crude imports, media reports suggest that a large part of those imports was actually sanctioned Iranian oil. Countries in Africa and Latin America account for about 10 % of China’s crude imports. At the shift of this year, China’s largest oil refiner, Sinopec, said that it expects gasoline consumption in China to start falling in 2027 as the electrification of the transport sector proceeds.
China’s domestic production covers about 60 % of its annual gas demand. The country imports gas by pipeline (less than 1 % of the value of China’s goods imports) and liquefied natural gas (LNG) (just under 2 % of the value of imports). China Customs reports that the total volume of gas imports increased by 10 % y-o-y last year and the volume of LNG imports rose by 8 %, which implies that pipeline gas imports increased by over 10 %. China ceased reporting of its pipeline gas import volumes in 2022. The pipeline gas import values show that China last year imported the most pipeline gas from Turkmenistan (45 % share). The volume of pipeline gas imports from Russia has increased in recent years as full pipeline capacity was achieved. Russian accounted for just under 40 % of the value of China’s total pipeline gas imports last year. China also imports pipeline gas comes from Myanmar, Kazakhstan and Uzbekistan. China’s largest LNG suppliers are Australia (34 % of total volume), Qatar (24 %), Russia (11 %) and Malaysia (10 %).
Coal continues to be an extremely important energy source for China. China produces domestically over 90 % of the coal it burns, but it also imports coal. The volume of China’s coal imports rose last year by 14 %, even as the value of coal fell by a couple percent. Coal accounted for 2 % of the total value of China’s goods imports. Indonesia was China’s biggest coal supplier last year, accounting for over 40 % of the total volume of China’s coal imports. Russia, Mongolia and Australia each accounted for 15–20 % of China’s coal imports. The volume of coal imports from Russia rose in 2022 and 2023, but last year the volume was about at the same level as in 2023.
Volumes of China’s crude oil imports by country

Sources: China Customs and BOFIT.