BOFIT Weekly Review 38/2022
Finnish goods exports to China contracted in the second quarter
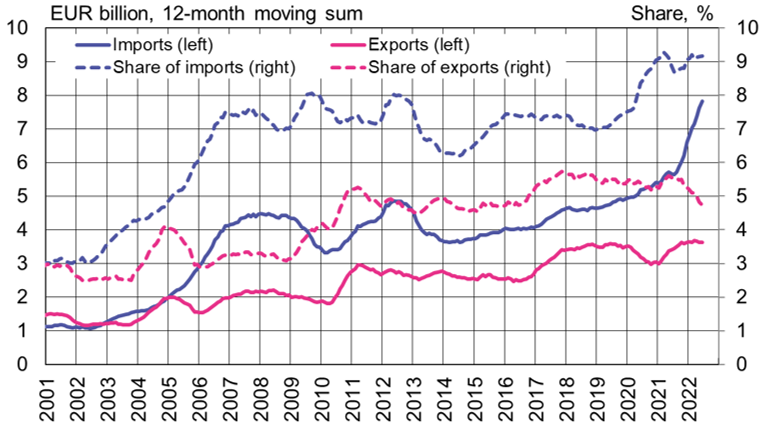
The value of goods exported from Finland to China in April-June amounted to 930 million euros, a nearly 6 % decline from a year earlier. Nearly 40 % of Finland’s exports to China consisted of raw materials. Their value was down by 18 % y-o-y in the second quarter. The overall value of Finnish 2Q exports rose by 27 % y-o-y. China’s share of Finnish exports fell to 4.5 %.
Finland imported goods valued at 2.1 billion euros from China in the second quarter, a 47 % increase from 2Q21. Finland’s imports from China increased slightly faster than imports overall (38 % y-o-y). China accounted for just under 9 % of Finnish imports. Roughly 60 % of Finland’s second-quarter imports from China consisted of machinery, equipment & vehicles. The value of imports in this category was up in the second quarter by over 50 % y-o-y. The biggest growth was in imports of generators and engines, electrical machinery and equipment, as well as machinery and equipment for general industrial use.
The value of exports of Finnish services to China in the second quarter amounted to nearly 300 million euros, an 18 % decrease from a year earlier. Finland imported services from China valued at 365 million euros in 2Q22, an increase of 16 % y-o-y. Finland has run a services trade deficit with China since the outbreak of the covid pandemic in 2020. China’s strict zero covid strategy has effectively killed Chinese tourism to Finland and complicated exports of many other services to China.
A discussion on the dependence on Chinese production has recently emerged also in Finland. The foreign trade figures published by Finnish Customs show that the largest China-dependent goods categories are machinery & equipment, textiles, furniture and other household products. 65 % of the laptop computers and almost half of phones imported to Finland last year came from China. Even if their share of total imports is marginal, Finland also relies heavily on China for certain metals and chemicals. The value-added figures give a similar picture: Finland uses value-added produced in China most in textiles and clothing, base metals, computers, as well as electrical and other devices. China represents a smaller share of services imports than goods imports. Finland, however, imports from China relatively more computer programming, consulting and IT services, as well as scientific and technical services, than e.g. Germany, the UK or the US.
Finland’s goods imports from China have risen considerably faster in recent year than exports to China

Sources: Finnish Customs and BOFIT.