BOFIT Weekly Review 1/2021
Robust third-quarter recovery in private consumption last year, Russian fixed investment contracted
Revised figures show that Russian GDP shrank in the third quarter by 3.4 % y-o-y. For the first three quarters of 2020, Russian GDP diminished by 3.4 % y-o-y. In the third quarter, seasonally adjusted GDP increased by 0.7 % from the previous quarter. Russia appears, at least for 2020, to have weathered the effects the covid-19 pandemic with considerably less economic harm than most European countries.
Rosstat recently released revised GDP figures for 2018 and 2019. Its earlier figures showed that Russian GDP in those years grew by 2.5 % and 1.3 %, respectively. The revised growth numbers are 2.8 % for 2018 and 2.0 % for 2019. Part of the 2019 improvement, for example, reflects higher figures for output of extractive industries (2.6 %) and manufacturing output (2.8 %).
Demand-side data from the national accounts suggest Russia experienced wide uneven swings in demand last year. In the third quarter of 2020, for example, private consumption sprang back from a second-quarter low, but was still down by 8.4 % y-o-y. Public consumption, which rose by 1.8 % y-o-y in 3Q20, helped support overall demand in Russia.
Russia’s GDP figures also have been bolstered by growth in net exports, albeit much of this reflects depressed imports. Indeed, the volume of imports in the second and third quarters plunged by over 20 % y-o-y. While the volume of exports was also down, it was clearly not as severe as the drop in imports.
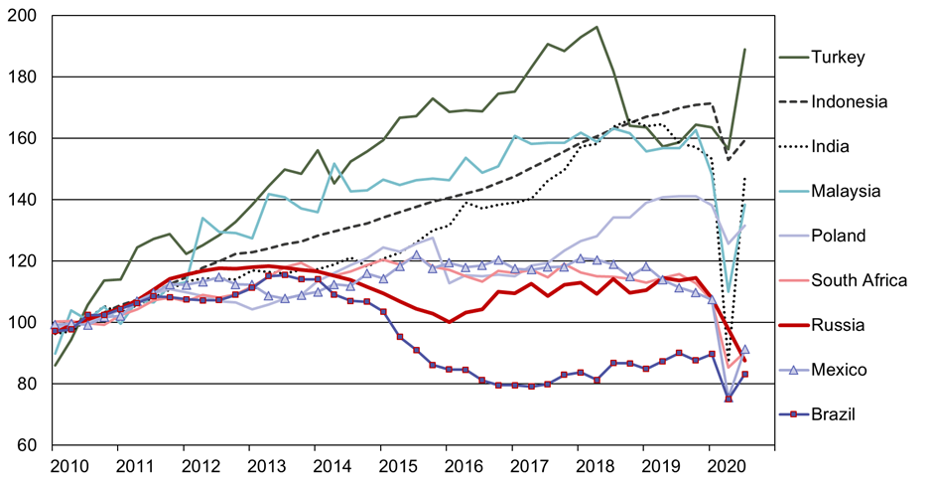
From the standpoint of Russia’s future growth, low fixed investment is worrisome. Fixed investment was particularly weak in the third quarter, which was the third quarter in a row of negative growth (down by 6 % y-o-y for the first nine months of 2020). Most notably, fixed investment in many other emerging economies recovered sharply in the third quarter. Fixed investment during the past decade peaked in Russia in the first half of 2013.
Fixed investment trends in select emerging economies over the past decade, 2010=100, volume, seasonally adjusted

Sources: National statistical agencies, Macrobond and BOFIT.